Token Buckets, Concurrency Caps, and Load Shedders: Rate Limiting That Holds Under Pressure
Token Buckets, Concurrency Caps, and Load Shedders: Rate Limiting That Holds Under Pressure
Every API eventually meets the customer whose retry loop has no backoff. You can buy your way out of it once by adding capacity. The second time, you build rate limiting.
This post walks through the same four mechanisms, what each one is genuinely for, the algorithms underneath, and the parts you only learn by running them.
Everything below uses one running system: routes-api, a fleet logistics platform. Three endpoint families that matter:
POST /v1/routes— solve a vehicle routing problem. CPU-bound, 200ms–40s depending on stop count. This is the money endpoint.GET /v1/routes/:id— cheap read, a few ms.GET /v1/analytics/*— heavy aggregate queries. Nice to have. Nobody’s trucks stop moving if it’s down.
Customers authenticate with an API key. One key equals one tenant.
The two different jobs
People collapse these into one word, and then build the wrong thing.
A rate limiter shapes one user’s traffic. Its input is who is asking. It answers “has this tenant taken more than its share?” It runs constantly, on a normal Tuesday, and its output is a 429 telling a specific caller to slow down. It only makes sense if your callers can spread requests out without changing the result — true for batch dispatch, false for a live webhook fan-out you can’t buffer.
A load shedder protects the system. Its input is how the fleet is doing right now. It answers “am I in trouble, and can I drop something to survive?” It runs during incidents, and its output is a 503 telling a caller the service is degraded. It doesn’t care who you are. It cares that analytics queries are eating the CPU that route solving needs.
Rate limiters are preventative and constant. Load shedders are reactive and rare. You need both, but you build them in that order.
Limiter 1: request rate limiter
N requests per second per tenant. Start here. This is the one that pays for itself in the first week.
Real numbers from a month on routes-api: this limiter rejected roughly 4.2 million requests. Almost none of it was malice. It was sandbox scripts in while true loops, a customer’s Airflow DAG retrying a failed task 60 times a minute, and one integration that polled GET /v1/routes/:id every 50ms instead of using webhooks.
Two design decisions worth stealing:
Apply the same limits in sandbox and production. If sandbox is unlimited, customers write code against a world that doesn’t exist and discover your limits on launch day. Identical behavior in both modes means the surprise happens while they’re still writing the integration.
Allow bursting. Traffic is not smooth. A dispatcher opens the morning planning screen and fires 300 route requests in four seconds, then goes quiet for ten minutes. A strict per-second cap rejects a legitimate, cheap pattern. So the limit isn’t really “100/s” — it’s “100/s sustained, up to 500 in a burst.”
Token bucket
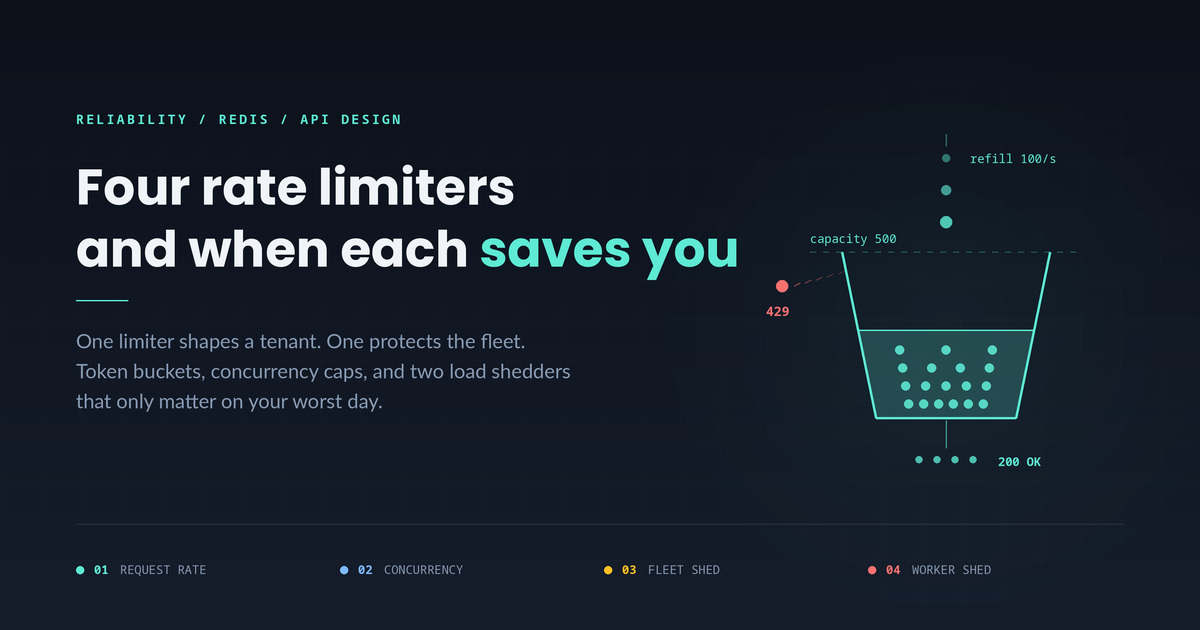
The algorithm is a bucket that drips.
capacity 500, refill 100/s

t=0s    ●●●●●●●●●●  500   full bucket, tenant idle
t=1s    ●●●●●●●●●●  500   still capped at capacity
t=2s    ○○○○○○○○○○    0   burst of 500 requests, all allowed
t=2.5s  ●○○○○○○○○○   50   refilling
t=3s    ●●○○○○○○○○  100
t=3s+   ─────────         steady state: 100/s pass, the 101st gets 429
Two numbers, two behaviors. capacity is how much burst you tolerate. rate is what you’ll sustain forever. Setting capacity to 5× the rate — five seconds of headroom — is a reasonable starting point.
The elegance is that you don’t store a request log. You store two values per tenant: token count and last-refill timestamp. On each request you compute how much time has passed, add that many tokens (capped at capacity), and take one if any remain.
# How many requests per second do you want a user to be allowed to do?
REPLENISH_RATE = 100

# How much bursting do you want to allow?
CAPACITY = 5 * REPLENISH_RATE

SCRIPT = File.read('request_rate_limiter.lua')

def check_request_rate_limiter(user)
  prefix = 'request_rate_limiter.' + user

  # Token bucket needs two keys: the count, and when we last topped it up.
  keys = [prefix + '.tokens', prefix + '.timestamp']
  args = [REPLENISH_RATE, CAPACITY, Time.new.to_i, 1]

  begin
    allowed, tokens_left = redis.eval(SCRIPT, keys, args)
  rescue RedisError => e
    # Fail open. A Redis outage must not become an API outage.
    # Alert on this — observed failure rate should be ~0.01%.
    log.error('rate limiter redis failed: ' + e)
    return
  end

  raise RateLimitError.new(status_code: 429) unless allowed
end
Why it has to be a Lua script
This is the part people skip and regret. Read-modify-write across a network is not atomic, and rate limiting is entirely read-modify-write.
two requests from the same tenant, one token left, naive client-side logic

  worker A                        worker B
  ─────────────────────────       ─────────────────────────
  GET tokens → 1
                                  GET tokens → 1
  1 >= 1, allow ✓
                                  1 >= 1, allow ✓
  SET tokens 0
                                  SET tokens 0

  result: 2 requests through a bucket that had capacity for 1
Under real concurrency you don’t leak one request, you leak a proportion of them — and the leak is worst exactly when the tenant is hammering you hardest, because that’s when the windows overlap most. A limiter that fails open under load is not a limiter.
Redis executes a script atomically: nothing runs between your GET and your SET. So the whole decision moves server-side.
local tokens_key = KEYS[1]
local timestamp_key = KEYS[2]

local rate = tonumber(ARGV[1])
local capacity = tonumber(ARGV[2])
local now = tonumber(ARGV[3])
local requested = tonumber(ARGV[4])

local fill_time = capacity/rate
local ttl = math.floor(fill_time*2)

local last_tokens = tonumber(redis.call("get", tokens_key))
if last_tokens == nil then
  last_tokens = capacity          -- unknown tenant starts full
end

local last_refreshed = tonumber(redis.call("get", timestamp_key))
if last_refreshed == nil then
  last_refreshed = 0
end

local delta = math.max(0, now-last_refreshed)
local filled_tokens = math.min(capacity, last_tokens+(delta*rate))
local allowed = filled_tokens >= requested
local new_tokens = filled_tokens
if allowed then
  new_tokens = filled_tokens - requested
end

redis.call("setex", tokens_key, ttl, new_tokens)
redis.call("setex", timestamp_key, ttl, now)

return { allowed, new_tokens }
Note the requested argument. It’s 1 for a normal request, but nothing stops you charging more. On routes-api we bill POST /v1/routes at a cost proportional to stop count, so a 2,000-stop optimization draws more tokens than a 5-stop one. Same bucket, same script, and suddenly the limit approximates work rather than request count.
About that TTL
The ttl = fill_time * 2 line has generated more confusion in the gist comments than everything else combined, usually phrased as “doesn’t expiry let people cheat?”
It doesn’t, and the reason is worth internalizing. setex rewrites the TTL on every request, so the keys only expire after 2 * fill_time of complete silence from that tenant. Meanwhile the bucket refills to full in fill_time. So by the time the key vanishes, the state it held was already “full bucket” — deleting it and recreating it from the last_tokens == nil → capacity default is identical. The TTL isn’t a limiting mechanism. It’s garbage collection, so a topic with a million one-time API keys doesn’t leave a million dead keys in Redis forever.
The one thing to actually watch: now comes from the application server, not Redis. Skewed clocks across your fleet mean tenants get slightly more or less than their rate. Run NTP, or use redis.call('TIME') inside the script and take the clock from one place.
Limiter 2: concurrent requests limiter
N requests in flight per tenant. Different question, different failure it prevents.
Requests-per-second says nothing about cost. A tenant sending 20 requests per second to GET /v1/routes/:id is trivial. A tenant sending 20 requests per second to POST /v1/routes, each holding a worker for 30 seconds, has 600 of your workers by the end of the minute. The request limiter waves all of it through, correctly by its own logic, while the fleet suffocates.
Then it gets worse on its own. Requests slow down under contention, users assume the request is stuck, users retry, retries add load, everything slows down further. The queue feeds itself.
A concurrency cap breaks that loop directly: 20 in flight, and the 21st gets rejected immediately instead of queueing behind the other 20.
This limiter fires far less often than the request limiter — order of ten thousand rejections a month against the request limiter’s millions — but it’s the difference between “slow” and “down” on expensive endpoints.
The implementation exploits the fact that Redis is fast enough for the obvious approach: put a random token in a sorted set when the request starts, remove it when the request ends, reject if the set is too big.
TTL = 60        # longest a request could plausibly take
CAPACITY = 100  # concurrent requests allowed per tenant

SCRIPT = File.read('concurrent_requests_limiter.lua')

class ConcurrentRequestLimiter
  def check(user)
    @timestamp = Time.new.to_i
    id = Random.new.bytes(4)   # long enough that two boxes don't collide within TTL
    key = 'concurrent_requests_limiter.' + user

    begin
      # Sweep entries from requests that died without cleaning up
      redis.zremrangebyscore(key, '-inf', @timestamp - TTL)
      allowed, count = redis.eval(SCRIPT, [key], [CAPACITY, @timestamp, id])
    rescue RedisError => e
      log.info('Redis failed: ' + e)
      return   # fail open, again
    end

    if allowed
      @id_in_redis = id   # remember it so we can release it
    else
      raise RateLimitError.new(status_code: 429)
    end
  end

  # MUST run after the request finishes — success, exception, or timeout
  def post_request_bookkeeping(user)
    return unless @id_in_redis
    redis.zrem('concurrent_requests_limiter.' + user, @id_in_redis)
  end
end
local key = KEYS[1]

local capacity = tonumber(ARGV[1])
local timestamp = tonumber(ARGV[2])
local id = ARGV[3]

local count = redis.call("zcard", key)
local allowed = count < capacity

if allowed then
  redis.call("zadd", key, timestamp, id)
end

return { allowed, count }
Three things this design gets right that a naive counter gets wrong:
Why a sorted set instead of INCR/DECR. A counter has no memory of which request incremented it. If a worker is OOM-killed mid-request, the decrement never happens and the counter drifts upward permanently. Give it a week and the tenant is locked out by a phantom 100 requests that finished long ago. The sorted set scores each entry by start time, so zremrangebyscore sweeps anything older than TTL on the next request. The limiter self-heals.
Why the ZCARD and ZADD are in Lua. Same race as before. Check-then-add across the network lets two workers both read 99 and both add.
Why the release must be in a finally. If post_request_bookkeeping is skipped on the exception path, you’ve built a slow leak that only manifests for your least reliable requests. Put it in an ensure block or middleware teardown, not at the bottom of the happy path.
The tradeoff to be honest about: concurrency limits push a different programming model onto your callers. A request limiter says “hammer away and back off on 429.” A concurrency limiter says “run a worker pool of size N.” The second is a nicer model for expensive work and an annoying one for simple scripts. Pick per endpoint family based on which your users actually write.
Limiter 3: fleet usage load shedder
Now we switch from shaping one tenant to protecting the system.
Split traffic into critical and non-critical. On routes-api, creating and solving routes is critical; analytics and reporting are not. Then reserve a fraction of the fleet — say 20% — that non-critical traffic can never touch. When non-critical work is occupying its 80% allocation, further non-critical requests get a 503.
The implementation is almost a joke: it’s the concurrent requests limiter with a global key instead of a per-tenant key.
limiter = ConcurrentRequestLimiter.new

def check_fleet_usage_load_shedder
  return if is_high_priority_request

  begin
    limiter.do_request('fleet_usage_load_shedder')
  rescue RateLimitError
    # 503, not 429 — this isn't the caller's fault
    raise RateLimitError.new(status_code: 503)
  end
end
Same sorted set, same Lua, one key for the whole fleet. Counting globally instead of per-tenant turns a fairness mechanism into a reservation mechanism.
This triggers rarely — a fraction of a percent of requests in a typical month, and in most of those months you had the headroom anyway. The value isn’t in the average month. It’s that during the bad month, the guarantee “analytics can never consume more than 80% of the fleet” holds without anyone waking up to enforce it.
The 429 versus 503 distinction matters here and is worth being deliberate about:
| 429 Too Many Requests | 503 Service Unavailable | |
|---|---|---|
| Means | you exceeded your limit | we are degraded |
| Cause | the caller’s traffic | our capacity |
| Caller should | slow down, permanently | retry with backoff, it’ll pass |
| Comes from | limiters 1 and 2 | limiters 3 and 4 |
Getting this backwards sends customers to your docs looking for a quota page during your incident, or has them file support tickets about an outage when they simply need to fix their loop.
Limiter 4: worker utilization load shedder
The last line of defense, and the only one that reacts to the machine’s own state rather than to counts.
Each box tracks its worker utilization: 1.0 means every process is busy, 0.5 means half. When that stays high, the box starts probabilistically dropping its least important traffic, in tiers:
escalation order as pressure rises

  sandbox traffic        ← shed first, nobody's trucks are affected
  GETs                   ← analytics, reads
  POSTs                  ← non-critical writes
  critical methods       ← never shed until everything else is gone
The important property is not what it sheds. It’s how slowly it moves.
END_OF_GOOD_UTILIZATION = 0.7
START_OF_BAD_UTILIZATION = 0.8

NUMBER_OF_SECONDS_BEFORE_SHEDDING_STARTS = 28
NUMBER_OF_SECONDS_TO_SHED_ALL_TRAFFIC = 120

def update_shedding_amount_derivative(utilization)
  if utilization < END_OF_GOOD_UTILIZATION
    # healthy: negative derivative, ramp shedding back down
    amount = utilization / END_OF_GOOD_UTILIZATION - 1
  elsif utilization < START_OF_BAD_UTILIZATION
    # dead zone: change nothing
    amount = 0
  else
    # unhealthy: positive derivative, ramp shedding up
    amount = (utilization - START_OF_BAD_UTILIZATION) / (1 - START_OF_BAD_UTILIZATION)
  end

  @shedding_amount_derivative = clamp(amount, -1, 1) / NUMBER_OF_SECONDS_TO_SHED_ALL_TRAFFIC
end
Read that as a controller, not a threshold. Three deliberate choices:
It sets a derivative, not a value. The code never says “shed 40%.” It says “increase shedding at this rate.” Shedding accumulates over time while pressure persists and decays while it doesn’t. Even pinned at 100% utilization, it takes two minutes to reach full shed.
There’s a dead zone between 0.7 and 0.8. Below 0.7, recover. Above 0.8, shed. In between, do nothing at all. Without that gap, a box oscillating around a single threshold flips between shedding and not shedding on every sample, and your graphs turn into a sawtooth that tells you nothing.
Nothing happens for the first ~28 seconds. At an 8-second sampling interval that’s three guaranteed samples. Utilization is a noisy measurement; a single spike from a slow database query isn’t an emergency and shouldn’t trigger one.
Every one of those numbers exists to prevent flapping — the failure mode where the shedder itself becomes the incident: drop test traffic → utilization drops → stop dropping → utilization spikes → drop again, oscillating every few seconds while nobody can tell whether the system is healthy. Sharp control loops on noisy inputs produce exactly this, and it is genuinely hard to diagnose from the outside because the symptom is intermittent, not constant.
This limiter fires almost never — a hundred requests in a good month. It doesn’t prevent incidents. It shortens them.
Putting it in production without breaking anyone
The algorithms are the easy half. The rollout is where you cause the outage you were trying to prevent.
Fail open, everywhere, and alert on it. Every rescue RedisError in the code above returns instead of raising. If Redis is unreachable, requests go through. This is not laziness — the alternative is that your rate limiter becomes a hard dependency of your API, and a Redis failover turns into a total outage. A limiter that fails closed converts a partial dependency failure into a full one. Fail open, but instrument it: a persistent 5% fail-open rate means you’re effectively not rate limiting and should know that.
Ship every limiter dark first. Run the full decision, record what it would have blocked, block nothing. Leave it for a week. You will find a customer whose entirely legitimate nightly batch trips your limit by 3×, and you would rather have that conversation before you break them than after. Dark launch turns “we caused an incident for our largest customer” into “we called them and raised their limit.”
Build the kill switch before you build the limiter. A feature flag per limiter, flippable without a deploy. During an incident you need to be able to eliminate the limiter as a suspect in seconds, and “we’re waiting on CI” is not an acceptable answer at 3am.
Make the error actionable. 429 Too Many Requests on its own tells a developer nothing they can act on. Say which limit, what it is, and when to come back:
HTTP/1.1 429 Too Many Requests
Retry-After: 3
RateLimit-Limit: 100
RateLimit-Remaining: 0
RateLimit-Reset: 3
Content-Type: application/json

{
  "error": {
    "type": "rate_limit_error",
    "message": "Request rate limit exceeded: 100 requests/second sustained (bursts to 500). Retry after 3s. See https://docs.routes-api.com/limits",
    "limit_type": "request_rate"
  }
}
Return the headers on successful responses too. A well-built client that can see RateLimit-Remaining falling can self-throttle and never hit the wall.
Tell clients to add jitter, and mean it. If a thousand clients all get Retry-After: 3, a thousand clients retry at the same instant and you get a second spike shaped exactly like the first. Publish backoff-with-jitter in your SDK and your docs: sleep(random(0, min(cap, base * 2**attempt))).
Watch per-tenant, not aggregate. Aggregate rejection rate hides the case that matters: one customer being throttled into the ground while the fleet looks fine. Alert on “any single tenant’s rejection rate crossed X,” not on the total.
The scaling ceiling nobody mentions
One thing the original writeup leaves implicit, and it’s the first wall you’ll hit at volume: a Redis EVAL is fast, but not free, and it’s serialized on a single-threaded server.
Benchmarks from real ElastiCache setups land somewhere around 20k–30k script executions per second per node, and a real limiter script does more work than a benchmark’s. If you’re calling one limiter per request and you’re above roughly 20k requests/second, the limiter itself becomes the bottleneck — and it’s on the critical path of every request you serve.
The ways out, roughly in order of effort:
- Shard by key. Tenant keys distribute naturally across a Redis Cluster; the two token-bucket keys just need a hash tag (
{tenant_id}.tokens) to stay on one node. This gets you most of the way and is the obvious first move. It does not help the global keys used by the fleet shedder, which stay single-node by definition. - Approximate locally. Give each app server a slice of the budget and let it enforce that slice in-process, syncing with Redis every N requests or every N milliseconds. You trade exactness for a huge drop in round trips. For limits like “100/s,” being off by a few percent is genuinely fine.
- Move it out of the request path. A dedicated limiter service (Lyft’s ratelimit behind Envoy) or a Redis module like redis-cell, which implements GCRA in Rust and does the whole decision in one command.
Worth knowing where the ceiling is before you’re standing under it.
Conclusion
Build limiter 1 and nothing else, at first. The request rate limiter catches the overwhelming majority of real incidents — runaway scripts and retry storms. The other three are for problems you have not had yet. Ship one, learn from its dark-launch data, and add the others as the failure modes actually show up.
Charge tokens by cost, not by request. Retrofitting weighted costs onto a limiter that counts requests means renegotiating every customer’s limit. Passing requested as a variable from day one costs nothing and lets you say “your 2,000-stop optimizations count as more” without a migration.
Decide 429 versus 503 once, write it down, and enforce it in code review. These get mixed up constantly, and the confusion lands on your customers exactly when you can least afford support load.
Never fail closed. I have seen a Redis failover cause a full API outage because someone decided the safe default was to reject when the limiter was unreachable. It is not the safe default. It converts a dependency blip into your worst day.
Instrument first, tune later. Every limiter should emit rejections by tenant, by endpoint, by limiter type from its first day in dark mode. Thresholds picked without that data are guesses, and you will find out they were wrong at the worst possible moment.
Rate limiting isn’t one mechanism, it’s four answers to four different questions: is this tenant sending too much, is this tenant holding too much, is low-priority work crowding out high-priority work, and is this box drowning. Build them in that order, dark launch each one, fail open, and make the errors say something useful. The code is a hundred lines. The discipline around it is what keeps the API up.
Sources
- Paul Tarjan, Scaling your API with rate limiters. The four-limiter taxonomy, the rate-limiter/load-shedder split, and the production numbers.
- Paul Tarjan, 0-rate-limiters.md — companion gist. Reference implementations in Ruby and Redis Lua the code samples above are adapted from it.
Further reading
- redis-cell — GCRA rate limiting as a Redis module, one command per decision.
- envoyproxy/ratelimit — Lyft’s standalone rate limit service, for moving the decision off the request path.
- RFC 6585 §4 (
429 Too Many Requests) and RFC 7231 §6.6.4 (503 Service Unavailable).